Postponed, not canceled—the boom is set to continue into 2027
Industrial Machine Vision Markets in September 2026
Dr.-Ing. Ronald Müller, Managing Advisor Strategy and M&A in Machine Vision, Vision Markets
Last month, we already examined the sharp rise in consensus revenue forecasts for the major image processing companies with (benevolent) skepticism. And just four weeks later, the boom has already been put into perspective: The growth forecast for 2026 fell from 16.8% to 13.9%. However, the forecast for 2027 rose from 6.8% to 9.5%. So the boom is hardly slowing down—it’s merely shifting slightly. Could this have something to do with the shortage of intermediate goods, particularly memory chips?
Europe is brightening up. German industry reached a 51-month high, driven by defense and data center orders, and defense contractors are now making nine-figure investments in mass-production capacity.
Regional Trends in Industrial Production
Just a brief note this time. Because the August issue was published late, only a few new year-over-year figures for industrial production have been added since then—too few to tell you anything that wasn’t already better illustrated in August. The picture remains unchanged: Asia is expanding capacity, Europe is treading water, and the U.S. is barely exceeding +1%. We’ll return to the production data in October once the summer figures are fully available.
Sentiment in the Global Manufacturing Sector
Global: 13 Months of Expansion—Engine Running at Full Throttle
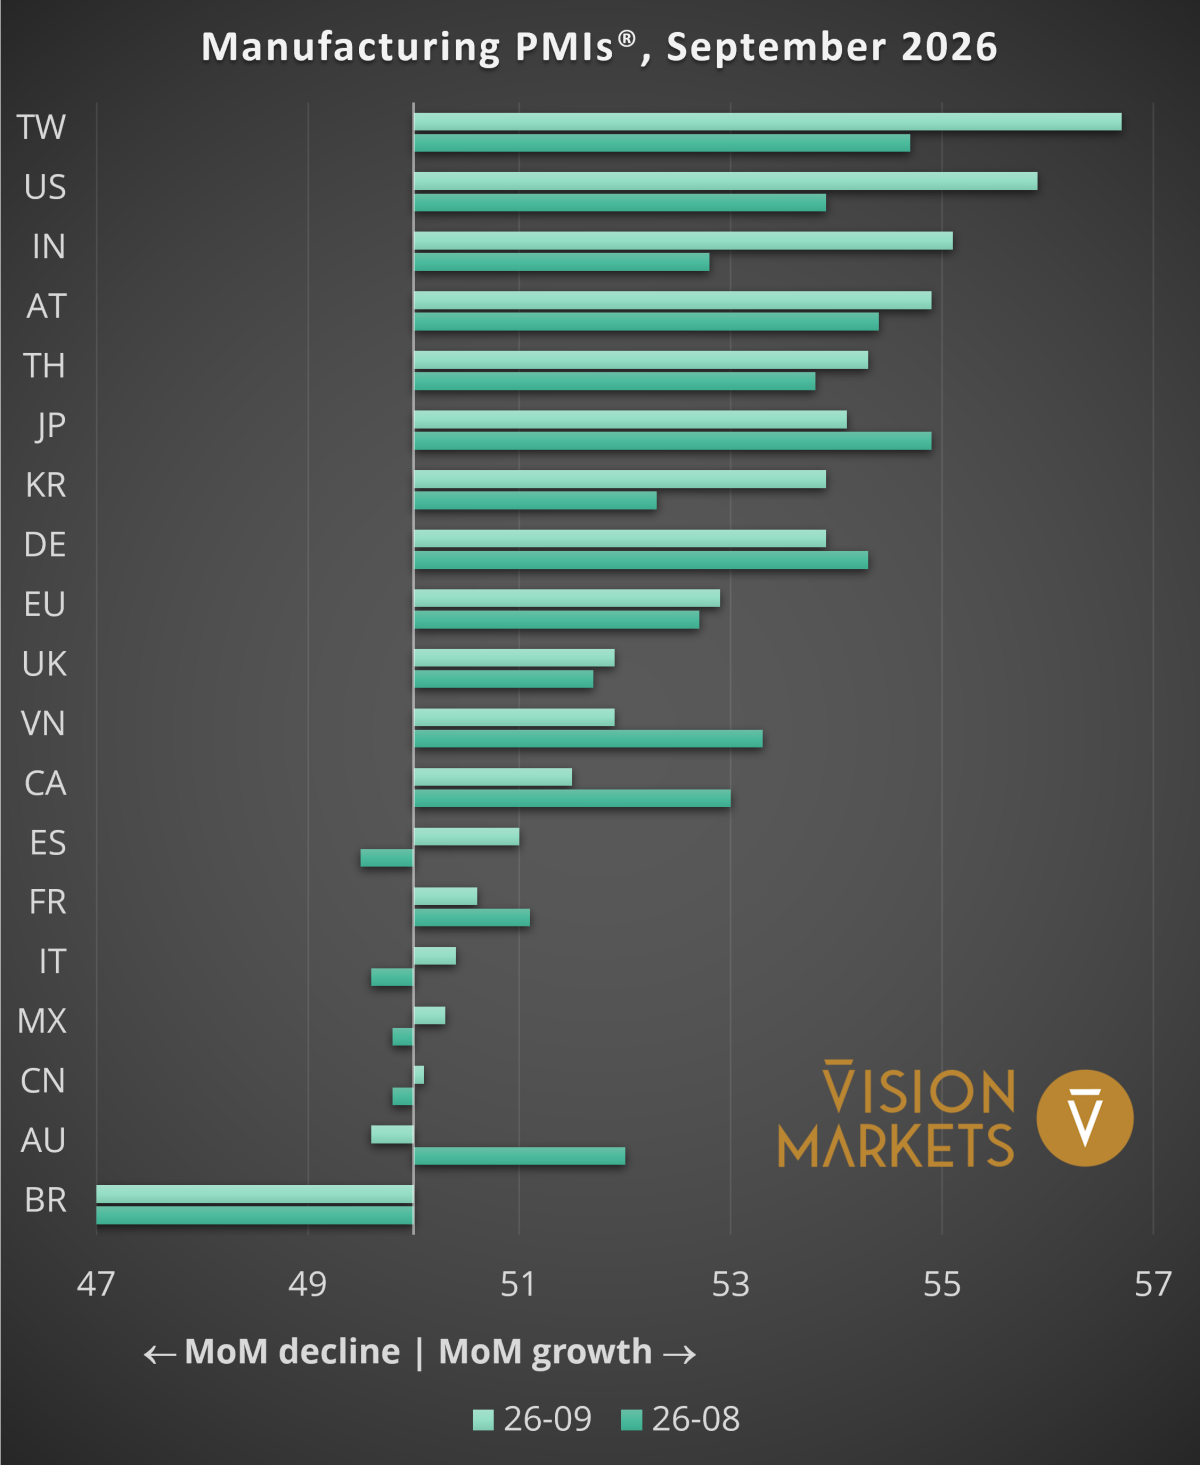
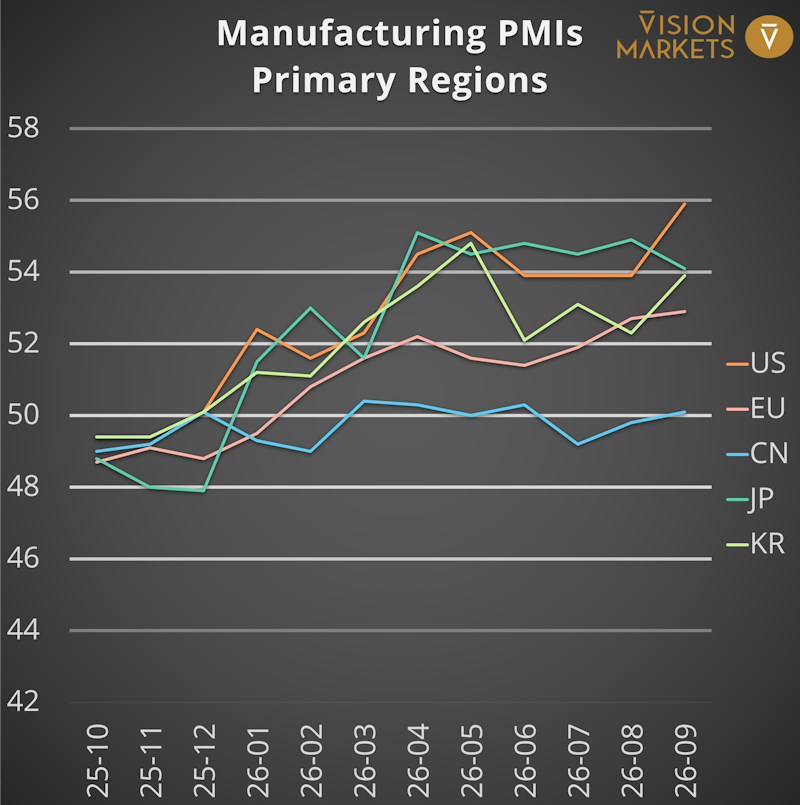
The J.P. Morgan Global Manufacturing PMI (M-PMI) rose to a three-month high of 52.3, signaling growth expectations for the thirteenth consecutive month. Production, new orders, and employment all grew at a faster pace, while export orders increased for the first time since April. Last month, we cited the employment figure as the most revealing data point in the survey; it has now reached a three-year high. Factory operators are slowly beginning to believe their own order books.
U.S.: Same Number, Third Month, Different Problem
The U.S. Manufacturing PMI remained unchanged at 53.9 for the third consecutive month, but its composition has shifted. Production grew at its slowest pace since February, exports declined for the fourteenth consecutive month due to tariffs, while employment rose more strongly than in any other month of 2026. The catch: Inventory buildup was a key driver of production and demand. But restocking is not a capacity cycle.
Eurozone: The Best Order Intake Since Early 2022
This is where the real change of the month lies. The Eurozone’s M-PMI climbed to 52.7, and the production index to 53.3—highs not seen in 51 and 54 months, respectively. In August, the region drew on its order buffer; now it is replenishing it. New orders grew at a rate not seen since early 2022, export activity increased for only the second time in four and a half years, and employment stopped declining after three years of contraction. Italy slipped back into contraction at 49.6, while Spain remained there at 49.5—so this is not yet a continental boom.
Germany: Defense and Data Centers
Germany is the unexpected driver of this turnaround in Europe, rising to a 51-month high of 54.3, with new orders growing at a rate not seen since February 2022. The surveyed companies explicitly cited the following drivers: defense spending, the construction of data centers, and stockpiling. Two caveats: Employment continues to decline, and supply chains have deteriorated—due to shortages of electronic components amid the AI boom and, a very European detail, low water levels on the Rhine.
China: Two Different Chinas in One Chart
The chart below shows the official NBS index, which stood at 49.8 in August and thus remains below 50. The private RatingDog survey, which places greater weight on smaller, export-oriented companies, came in at 51.5—marking the ninth consecutive month of expansion. Both figures are accurate, and the gap between them is the real story: state-affiliated heavy industry is treading water, while the private export engine is running full steam ahead. New orders rose for the fifteenth consecutive month, while at the same time manufacturers lowered their selling prices for the first time in 2026. The risk here lies not in volume, but in margins.
Japan: Best New Orders Since 2018
Japan climbed to 54.9, marking its eighth consecutive improvement. New business grew at its fastest pace in over eight and a half years, while export orders grew at their fastest pace since early 2018; semiconductors and AI-related products were once again cited as key drivers. Employment rose as strongly as it last did in February 2018. Japan has shifted from capacity constraints to hiring and investing—and that’s precisely when budgets for image processing and automation technology open up.
South Korea: Exports at a Six-Year High, but Capacity Is a Hindrance
South Korea’s index fell to 52.3, yet export sales rose at a rate not seen since November 2020. It is interesting to note why the headline figure was weaker: Material shortages are hindering order fulfillment, and finished goods inventories fell at their fastest rate since May because products were shipped directly from the assembly line. High demand coupled with tight supply is the classic trigger for investments in yield and throughput.
India and ASEAN: One is cooling off, the other is approaching a record
India slipped to 52.8, its lowest level in five years and the third consecutive slowdown in growth; employment fell for the first time in two and a half years. Unlike in the previous month, the cushion provided by capital goods is no longer holding up; only consumer goods remained stable. ASEAN edged down slightly to 52.3, but new orders recorded the second-strongest increase in the survey’s history.
Revenue Trends of the Major Market Players
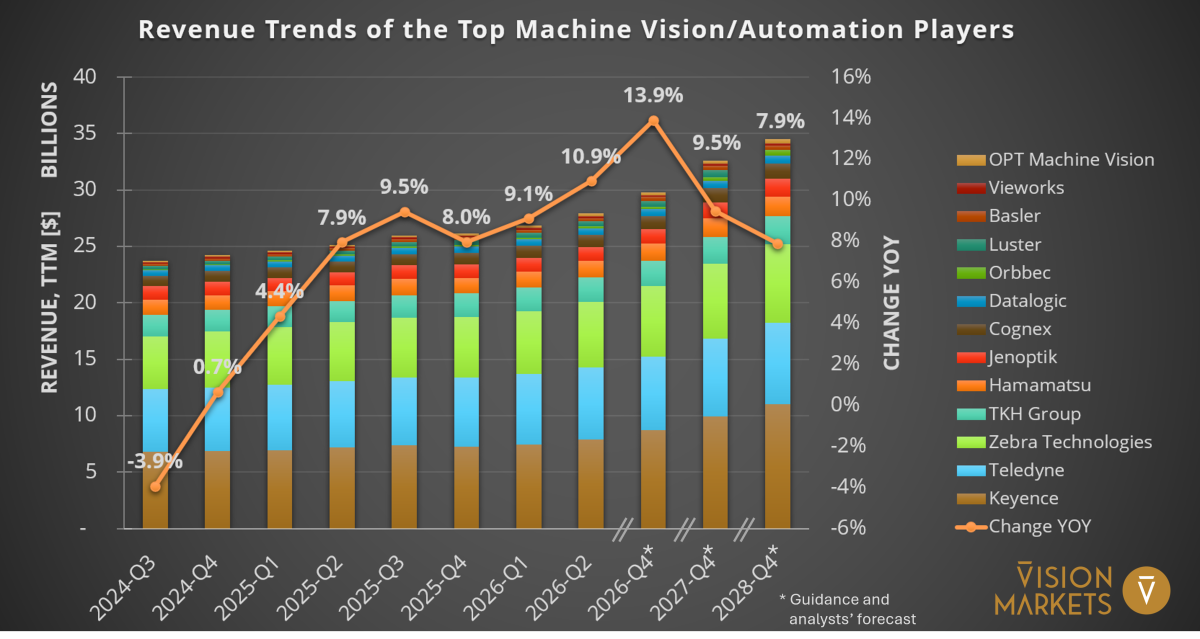
Last month, we flagged the “hockey stick” in the consensus as a figure to be viewed with skepticism. It did not hold up over the past few weeks. The aggregate growth forecast for 2026 was lowered from 16.8% to 13.9% for the observed publicly traded companies, while the forecast for 2027 was raised from 6.8% to 9.5% and for 2028 from 5.5% to 7.9%. Nothing was removed from the forecast; the boom was simply pushed back by one year. Keyence is a major part of the story behind this—the estimate for 2026 fell from 29.9% to 19.8%, while the one for 2027 rose from 5.3% to 14.2%, a shift spanning the turn of the year. Orbbec’s forecast was cut from 68.8% to 56.1%, and Luster’s from 36.8% to 27.6%, the latter also due to a downward revision of reported second-quarter revenue. The actual figures, on the other hand, hardly changed: $27.9 billion in cumulative twelve-month revenue at the end of the second quarter, up 10.9% from the previous year. That’s the number that counts. When estimates fall and the actual figures hold steady, the market doesn’t weaken—it just means the analysts were too quick to jump to conclusions.
Special Report: The Defense Industry Is Building Factories, Not Just Building Up Its Order Backlog
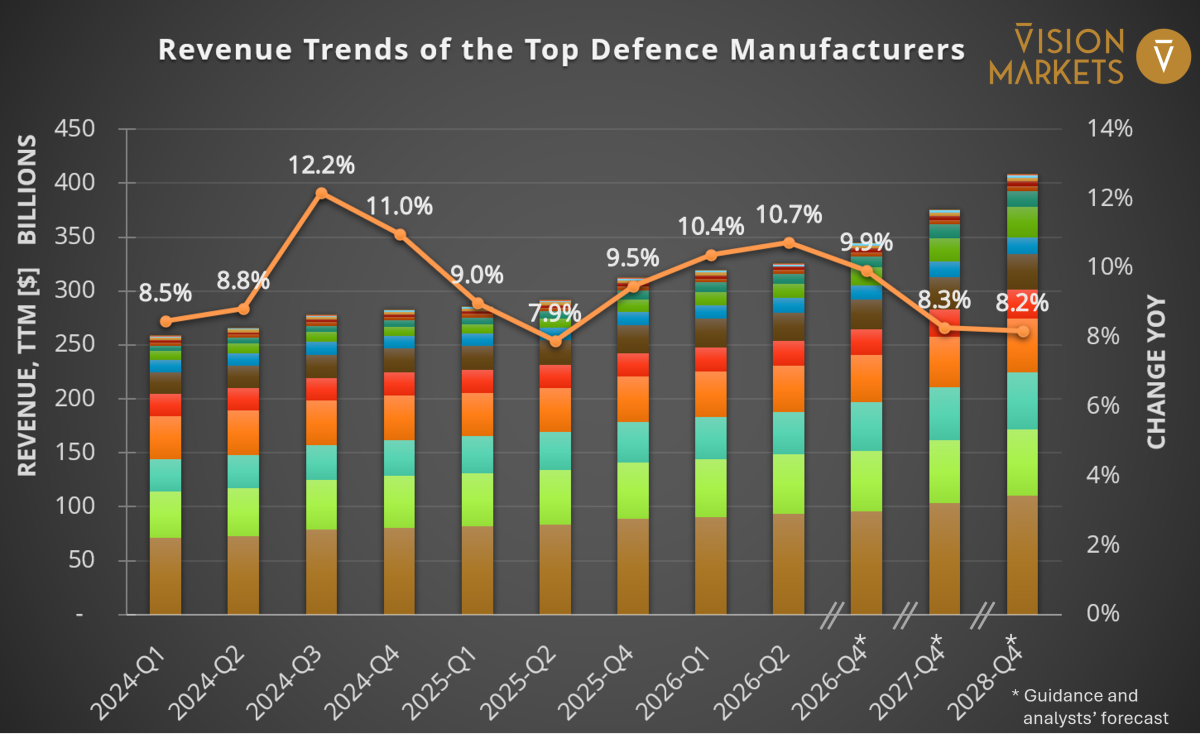
With a panel of sixteen companies and specialists, our defense index is now large enough to provide a reliable measurement: $402 billion in twelve-month revenue as of the end of the second quarter of 2026, up 10.7% from the previous year, compared to a consensus forecast of +9.9% for 2026 and +8.3% for 2027.
The ranking is the real news. The five fastest-growing companies are all European—Rheinmetall (+59.4%), Saab (+39.9%), Exosens (+28.9%), Hensoldt (+22.6%), and RENK (+18.2%)—while the U.S. heavyweights range between 6% and 12%. Three of these five are component and sensor manufacturers rather than platform companies—that is, they operate at the level where production volumes determine factory design. BAE Systems is the exception among the major players; the consensus forecast for 2026 has been raised to +18.7%.
What the companies do with the money is even more revealing than the growth rates. BAE has an order backlog of 84 billion pounds and is increasing its investments in the U.S. by 40% this year, specifically for digital tools and production automation; its subsidiary Hägglunds (tracked vehicles) expects to quadruple production, and Saab is nearly doubling production of the Gripen fighter jet to 30 units per year. Rheinmetall is investing 8 to 9% of its revenue; the plant in Unterlüß (Germany) alone costs just under 500 million euros and is expected to deliver 350,000 shells per year by 2027. Lockheed Martin is investing over $9 billion in more than twenty locations; the new plant in Jessup (USA) relies on augmented-reality wiring panels, a digital twin of the production floor, and automated material flows. On top of all this, Exosens is investing 20 million euros in its first U.S. plant for image intensifier tubes, with production set to begin in early 2027.
Do you hear the keywords? Mass production, digital twin, automated material flows, a fourfold increase in production. The defense industry is shifting from custom manufacturing to mass production—precisely the transition that drives demand for image processing, and this in an industry where traceability is mandatory.
By the way: On October 7, visitors to the Vision trade show in Stuttgart (Germany) can attend the VISION Guided Tours – Aerospace & Defense, where more than 25 exhibitors will showcase their innovations in image processing for aerospace and defense applications.
What to Do About a Boom That Has Been Delayed by a Year
Three things emerge from this month’s data. Anyone selling to Europe should know: The turnaround in the order book is real, and the conversation has shifted from defending margins to building new product lines—act before the calendars fill up. Anyone selling to the defense industry should have inspection and traceability systems in place by the end of this year, because mass-production programs select their partners early and stick with them. And anyone who based their planning for 2026 on the consensus—which we published last month—despite our warnings should revise it. If you’d like assistance in determining which regions and customers to focus on, please contact us.
What We’ll Be Watching in the Coming Months
Whether Europe’s new orders will weather the shortage of AI-related components; whether China’s first price cuts of 2026 will have an impact beyond the domestic market; and whether India’s economic slowdown will affect capital goods. A new quarter begins in October, so we will analyze the market participants’ financial reports and update our forecasts.